Unit Title: Analytical Techniques For Supply Chain Management
Introduction : In this Analytical Techniques for Supply Chain Management Assignment, you will be presented four questions, each having a corresponding mark provided in the title. Some questions have sub-questions and you will see the corresponding marks. Questions are designed in a way that you get a chance to revisit the concepts we have learned in class.
Analytical Techniques For Supply Chain Management Assignment – Cranfield University UK.

Limit your answers to 500 words for each question. Remember, this is an upper limit, not a target. Your answer to some calculation questions could have as few as 20 words. For theoretical questions, please identify at least one academic reference, ideally a journal paper, to support your arguments.
Please use the discussion board for any questions you might have about this assignment.We will answer all questions that are asked on or before 1 December 2021 12 pm to minimise the last-minute stress and encourage timely attention to the assignment.
It has been a great pleasure to teach you these subjects. We hope you enjoy this assignment and use the techniques in the future.
Disclaimer: Although the problems presented in this assignment are informed by real events, the names, characters, businesses, places, events, locales, and incidents are the products of the authors’ imagination. Any resemblance to actual persons, actual businesses, or actual events is coincidental. For the statistics part of the assignment, we share with you an Excel sheet that is comprised of customers of a retail store that sells a limited range of products. The “Customers. xlsx” file has several variables, which can be categorised as customer-related, product-related, promotion-related, and place-related:
Customer related :
1.ID: Customer’s unique identifier
2.Year_Birth: Customer’s birth year
3.Education: Customer’s education level
4.Marital_Status: Customer’s marital status
5.Income: Customer’s yearly household income
6. Kid home: Number of children in customer’s household
7. D t Customer: Date of customer’s enrolment with the company
8.Recency: Number of days since customer’s last purchase
9.Complain: 1 if customer complained in the last 2 years, 0 otherwise
Product-related
1. Mnt Wines: Amount spent on wine in last 2 years
2. MntFruits: Amount spent on fruits in last 2 years
3. Mnt Meat Products: Amount spent on meat in last 2 years
4. Mnt Fish Products: Amount spent on fish in last 2 years
5. MntSweetProducts: Amount spent on sweets in last 2 years
6. Mnt Gold Prods: Amount spent on gold in last 2 years
Promotion-related
- NumDealsPurchases: Number of purchases made with a discount
- Response: 1 if customer accepted the offer in the last campaign, 0 otherwise
Place-related:
18. Num Web Purchases: Number of purchases made through the company’s web site
19. Num Catalog Purchases: Number of purchases made using a catalogue
20. Num Store Purchases: Number of purchases made directly in stores
21. Num Web Visits Month: Number of visits to company’s web site in the last month
The director of supply chain is preparing a report for the upcoming sales and operations planning meeting and has asked you to analyse the data and derive insights and conclusions.
Probability Distributions and Confidence Interval Building
1.What is the probability that for at most 10 out of 100 randomly selected customers to have complained within the last two years? Use the sample data of 2,240 customers to calculate the probability of success. What is your advice after observing the result?
2.Construct a 99% confidence interval for the true average of customer “total spend”. How the confidence interval would change if you reduce the confidence level?
Analytical Techniques For Supply Chain Management Assignment – Cranfield University UK.

Hypothesis Testing :
3.Can the director conclude that the total spend of those customers who did not complain was greater than the total spend of those who complained?
a. Conduct the appropriate test at alpha = 0.01 significance level and interpret the results
b. How confident are you with your decision?
Regression :
4.The supply chain director would like to analyse the relationship of the variables in the data set with customer total spend and derive a regression model. Consider constructing new variables if appropriate and provide your reasons if you do so.
a. Develop an appropriate multiple regression model to explain the variability in customer total spend. Assume alpha = 0.01
b. Interpret the regression results.
c. Discuss the outliers and normality assumptions and comment on the suitability of a multiple linear regression model
d.How can you potentially improve the model?
Application of Inferential Statistics :
5.We frequently rely on inferential statistics to inform operational, tactical, and strategic decisions in many areas of supply chain management. Choose two examples of the application of inferential statistics in procurement, logistics and supply chain management. Briefly discuss the context, relevant managerial problem and elaborate how the knowledge of inferential statistics may aid the decision making in each example. Please make your response in no more than 150 words per example
Linear Programming :
6. Cranfield Manufacturing makes six components for sale to refrigeration companies. Thermostatic Expansion Valve (TXV): TXV is a device that controls the amount of refrigerant that flows to the evaporator. There you will find the flood back that is essential to maximise the productivity of the evaporator, while stopping the extra liquid refrigerant from going back to the compressor. This device also helps to separate the high-pressure and the low-pressure sides of an air conditioning system. Through the system’s liquid line, high pressured liquid refrigerant enters the valve but with the TXV’s presence, the amount of liquid refrigerant entering the evaporator will be reduced. Evaporator (EVA): It removes the unwanted heat from the product through liquid refrigerants. The liquid refrigerant must be at a low-pressure. This low- pressure can be determined by two factors – one is the heat being absorbed from the product to the liquid refrigerant and the other is the removal of low-pressure vapour by the compressor.
Capacity Control System (CCS): It regulates the power and energy consumption, although it can also manage dehumidification or decrease compressor cycling. The on/off cycling of the compressor is the simplest form of
capacity control. Compressor (COM): This draws low-temperature and low-pressure vapour from the evaporator through the suction line; the vapour will automatically be compressed once diverted – there will also be a rise in the temperature if the vapour is compressed. A compressor can convert low-temperatures to high-temperatures,
which can be the cause of an increase in pressure. Through a compressor, heat can be easily released. Condenser (CON): This device can extract heat from the refrigerant. Fans placed above the condenser unit draw air over the condenser coils. The temperature of condensation should range from around -12°C to -1°C; vapour will be cooled until it becomes a liquid refrigerant again, whereby it will retain some heat. Receiver (REC): As a temporary storage and a surge tank for liquid refrigerant, the receiver acts as a vapour seal. With a primary purpose of preserving the vapour
moving down the liquid line to the expansion valve, receivers can be made for both horizontal and vertical installation. The components go through four machines/processes as per the table below with the times in minutes required in
each machine/process for each component:
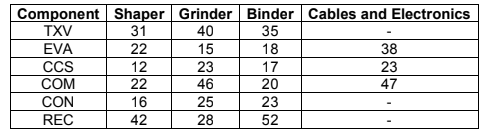
The shaper is available for 1200 hours, the grinder is available for 1100 hours, and the binder is available for 1000 hours. Cables and Electronics process has 800 hours available. No more than 200 units of CCS can be sold, but up to 1,000 units of each of the other components can be sold. The company already has orders for 600 units of TXV that must be satisfied. The profit contribution of TXV is £90, EVA is £198, CCS is £128, COM is £204, CON is £140, and REC is £15.
a.Formulate and solve Cranfield Manufacturing’s production problem for the recommended production quantities.
b.What are the objective function coefficient ranges for the six components?Interpret these ranges for the company management.
c.What are the right-hand-side ranges? Interpret these ranges for company management.
d.If one more hour of grinder time could be made available, how much would it be worth?
e. For which component does it make sense to find additional demand? Explain.
f. If Cranfield Manufacturing has promised to deliver 200 receivers to a company, what would be the impact on profit.
g. In a typical product mix model where a company must decide how much of each product to produce, discuss possible situations where there may not be any feasible solution. Could this be realistic? If you had such a situation in
your company, how might you proceed?
Decision Models :
7. Cranfield Manufacturing Ltd must decide to manufacture a component part at its Milton Keynes plant or purchase the component part from a supplier based in Northampton. The resulting profit is dependent upon the demand for the product. The following payoff table with three states of nature for the demand (low, medium, high) shows the projected profit in thousands of pounds:
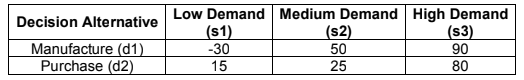
The state-of-nature probabilities are P(s1) = 0.30, P(s2) = 0.45, and P(s3) = 0.25.
a. Use a decision tree to recommend Cranfield Manufacturing a decision.
b. Use EVPI to determine whether Cranfield Manufacturing should attempt to obtain a better estimate of demand.
c. A test market study of the potential demand for the product is expected to report either favourable (F) or unfavourable (U) result. The relevant conditional probabilities are as follows:
P(F | s1) = 0.15; P(F | s2) = 0.45; P(F | s3) = 0.65;
P(U | s1) = 0.85; P(U | s2) = 0.55; P(U | s3) = 0.35.
What is the probability that the market research report will be favourable?
d. What is Cranfield Manufacturing’s optimal decision strategy assuming conducting market research is a possible course of action?
e. How much would Cranfield Manufacturing be willing to pay for market research?
f. What is the efficiency of market information?
g. What are some limitations of the analysis approach you have taken to address Cranfield Manufacturing’s decision problem?
Analytical Techniques For Supply Chain Management Assignment – Cranfield University UK.

Style and Presentation :
You will receive marks for the style and presentation of your assignment. Please pay attention to
1.Writing grammatically correctly and concisely.
2.Providing captions for your tables and figures and citing them in the text.
3.Using appropriate level of accuracy (no need for 5 figures after the decimal point. We recommend 3).
4.Presenting your assignment in a report structure so we can map your answers to the questions we have asked.
5.Citing the references you used in preparing your answers.
ORDER This Analytical Techniques For Supply Chain Management Assignment NOW And Get Instant Discount