Instructions to Students: Answer ALL of the questions.
Materials:
Calculators are not permitted.
Dictionaries are not permitted
Assignment: AS1055 Applications of Information Technology-City, University of London.
Question 1
A small study is carried out to measure the long-term effects of altitude change on human blood pressure. As part of this study, anthropologists measure the blood pressure of a small group of male participants who have permanently migrated from high altitude regions to substantially lower climes. In addition, the measurements included other vital statistics such as age, weight and height.
The “AS1055 AIT – JAN 2018 – EX Q1.mpj” Minitab project contains the data collected as part of this study. Thus, the columns of the given “Question1.mtw” worksheet represent the following:
Age Age of the participant at the last birthday in whole years
Years Number of years since migration
Weight Weight of the participant in kilograms
Height Height of the participant in millimetres
Systol Systolic blood pressure of the participant
Diastol Diastolic blood pressure of the participant
Carry out in Minitab alone the following statistical analysis:
- Express the length of stay in a lower climate in the form of a new categorical
Variable calculated from the years variable , based on the following logical conditions :
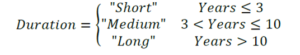
Where Duration is a new variable comprising of the above text qualifiers. Make use of a nested If() function expression in the Minitab Calculator and save the Duration variable in Question1 worksheet as a formula.[5 marks]
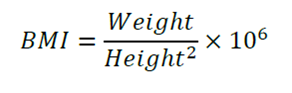
2.Calculate a new variable from the Weight and Height variables that measures the body mass index of the participants, rounded to 1 decimal place, based on the following formula:
 [3 marks]
ORDER This AS1055 Applications of Information Technology Assignment-City, University of London NOW And Get Instant Discount

3.Recode the Age variable into a new categorical text variable, named as Recorded age .As shown in following conditions

Also, make sure to show a summary table of the new variable in the Session Window and comment briefly in the ReportPad to the makeup of the sample with respect to age.[4 marks]
4.Create a pie chart based on counts of observations of the Recoded Age Make use of Duration as a panel variable in order to sub-group the observations in terms of length of stay in the lower climate. Set the title of the plot to “Number of participants by age group and duration” and the footnote to “Anthropological study”. Make sure that the pie chart slices are coloured separately by age alone and are labelled correspondingly in a legend at the side of the plotting region. Further, add to the graph slice labels (with short connecting lines) that show the frequency counts of each subgroup.
Briefly write down your observations in the ReportPad based on this graph about the migration patterns observed in the data set. [8 marks]
5.Create a comparative plot of histograms of the systolic and the diastolic blood pressure observations (i.e. Systol and Diastol) with respect to Duration. Thus, the histograms should be displayed in six separate panels by length of stay with the following settings:
- the same scale;
- the same bin sizes;
- the vertical axes of the histograms show density of data;
- the bars are coloured by Duration alone (i.e. the levels are labelled correspondingly in a legend at the side of the plotting region by Duration).
Briefly write down your observations in the ReportPad about the shape of the two distributions with respect to Duration.[10 marks]
6.Make use of a comparative boxplot of the BMI variable in order to investigate the differences in fitness of the migrants by the Recoded Age The box-and-whisker plots should have the following settings:
- are displayed horizontally on the same scale;
- are placed in a single graphing area (i.e. without panels);
- show the median symbols which are also connected by straight lines across the sub-groups;
- the IQR bars should be coloured (or filled) differently by the Recoded Age grouping factor (i.e. the levels are labelled correspondingly in a legend at the side of the plotting region by Recoded Age).
Considering that the healthy BMI value is between 20 – 25, comment briefly in the ReportPad whether or not you can see any evidence that the participants in this sample are gaining significant extra body weight with age.[10 marks] [Total 40 marks]
Question 2: AS1055 Applications of Information Technology Assignment
Consider the following (somewhat inefficient) worksheet formula that was entered in the range B5:B20 of “Question 2” worksheet with the purpose of calculating a mathematical function g(x) for the set of real values given in the range A5:A20:
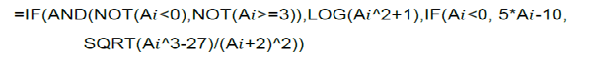
where i represents the corresponding row number. Thus, carry out the following:
- Rewrite the above formula by making use of the following approaches:
- Only a nested IF worksheet function structure with two levels. [5 marks]
- An IF worksheet function with the logical condition of Ai <0 nested within an IFERROR worksheet function (i.e. as its second argument).[6 marks]
2.Making use of the Equation Editor, complete in the text-box given in column G the mathematical expression of function g(x) [4 marks] [Total 15 marks]
ORDER This AS1055 Applications of Information Technology Assignment-City, University of London NOW And Get Instant Discount
Read More :-
BA3020QA Using And Managing Data And Information Assignment 3 – London

