Assignment 3
Task 1:A supermarket manager wanted to investigate the profile of shoppers resistant to the use of self-checkout counters available at the store he manages and to find out the reasons behind their resistance. He asks three of his staff to conduct a survey among customers using the store in Sheffield Hallam area during a quiet working day in October of 2019 as they exited the store.
BA3020QA Using And Managing Data And Information Assignment UK.

The short questionnaire used for the survey as well as the data collected can be found on an Excel file named “SCC”. There are two worksheets, one for the questionnaire used and the other worksheet for the raw data collected from the customers. The data worksheet has 18 columns. Column A“Customer” is simply a column to identify the customer surveyed – Customer 1, Customer 2 etc… Each of the other 17 columns refer to a question – Column B refers to the gender question, Column C refers to the age question etc…
The manager has employed you as data analyst to conduct this investigation.Your analysis should use the statistical facilities on Excel as required below.
Required:
1.Label the codes for the categories of the following variables:
• Gender
• Age
• Education
• Are you a regular user of self-checkout
2.Produce frequency and percentage frequency tables for each of the following variables:
• Gender
• Education
• Age
• SCC user
• Spending (£) For this last quantitative variable, the categories should be as
follows:

3.Draw the graphical representation for each of the following variables:
• Education (Pie chart)
• Age (Bar chart)
• Spending (Histogram) using the following categories:

• Spending (Box and whisker) graph
4.Consider now the variable “Spending (£)”.
• Calculate the minimum, maximum, median, quartiles and the mean average statistics.
Note:
The tasks and all their requirements should be clearly separated (preferably each task starts on a separate page). All variables should be clearly named and their correct categories clearly labelled. Graphs should be appropriate and correctly labelled and each of them on the same page. Any calculations should be clearly presented and explained.
Task 2
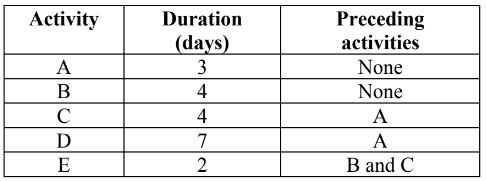
A plumber has decided to use the techniques of project management in order to plan a job. He knew all the different activities of the job, their precedence and their average durations. They are shown on the table below.
Required:
1.Draw a network diagram representing the sequence of activities and the dependence between them.
2.Determine how long it will take to complete the job by conducting the forward pass
3.By conducting the backward pass, identify the critical path and the non- critical path(s).
Note:
The work for this task should be produced using Word drawing facilities. The forward and backward passes should be clearly shown on the diagram. The calculations should be shown next to the network diagram.
Task 3
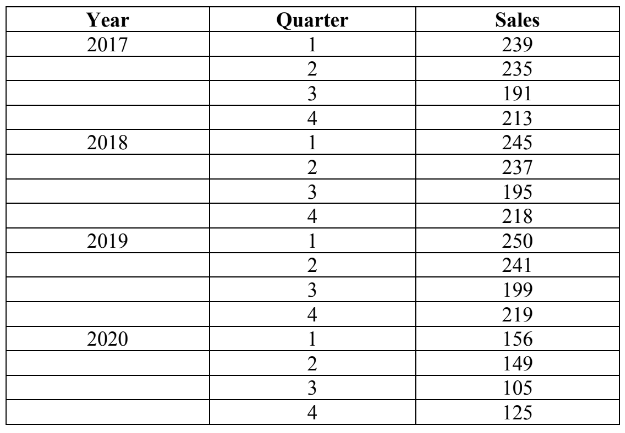
The quarterly sales figures for the number of shoes (pairs) sold at a shoe shop is shown on the table below.
Required:
1.Draw a line graph to represent the sales figures.
2.Calculate the moving averages.
3.Calculate the centre moving averages
4.Present the original sales data and the trend of sales figures on the same line graph.
Task 4
The following information relates to the probability of two different managers selecting a salesperson for a job:
Probability of Manager Sam choosing a Salesperson is 0.5
Probability of Manager Alex choosing a Salesperson is 0.3
Over the last 10 working days, Manager Sam has worked for 6 days and
Manager Alex worked 4 days. Only one manager works in a day.
BA3020QA Using And Managing Data And Information Assignment UK.

Required:
Build a Tree diagram to show the probabilities of a Salesperson being
selected.
Show the different branches of the Tree diagram with all the calculations.
Include in the Tree diagram the overall probabilities.
Task 5
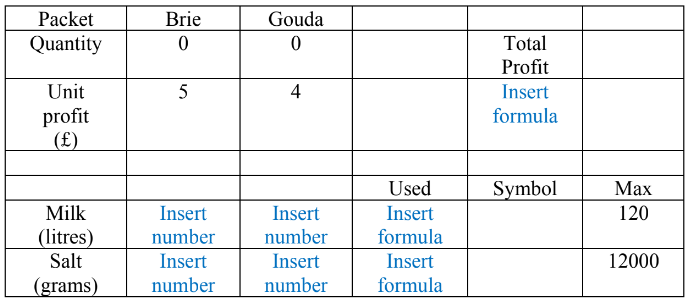
A small cheese maker specialises in two types of cheese – Brie and Gouda
that he makes and sells in packets of 400 grams. The cheese maker has
estimated that each packet of Brie uses 1.8 litres of special milk and 100
grams of special salt. For the Gouda cheese packet, the amounts of special
milk and salt needed are 1.2 litre and 150 grams respectively. The cheese
maker has a limited supply of special milk and salt and a maximum of only
120 litres of milk and 12000 grams of salt is made available each week. Once
produced and sold, the Brie packet returns a £5 profit and £4 profit for the
Gouda cheese.
Required:
1.Enter the information on the table below into an Excel file. You should also insert an appropriate formula for “Total profit” and quantity “Used” for each of the “milk” and “salt” resource in the cells as indicated below.
2.Find the solution of the linear programming problem (using Excel Solver)
3.State the production of each type of cheese that yield maximum profit.
ORDER This BA3020QA Using And Managing Data And Information Assignment NOW And Get Instant Discount