Restriction Enzyme Mapping & Forensic PCR Analysis of Brief Description of Assessment Task
- You are provided with information about two experimental studies (Restriction fragment mapping, and DNA fingerprinting) in this referral assignment brief. This includes data that you must analyse and interpret.
- You must write a report that answers the questions set out in this referral brief about these two experimental studies. These questions require you to source appropriate information from the scientific literature, analyse and interpret data from molecular biology techniques, and evaluate how these techniques work and how they relate to human biology and disease.
Outline Of Report Structure
This assignment brief explains the basic structure and requirements of your report. You must read and follow this specific guidance in order to pass the assessment. Ensure that you carefully follow the instructions in this document, and use the referral data given to you here, to prepare your
report.
Your report should contain three sections; Restriction Fragment Mapping, DNA Fingerprinting, and References. Each section should be clearly labelled with the appropriate subheading. Within each section you must fully answer the questions set below (Restriction Fragment Mapping Q1-6,
DNA Fingerprinting Q7-13). Make sure that you number your answers clearly with the question number. Clarity of English language and presentation is essential throughout, as is in-text referencing.
Restriction Fragment Mapping (Q1-6 approx. 1500 words)
Experimental Outline and Data
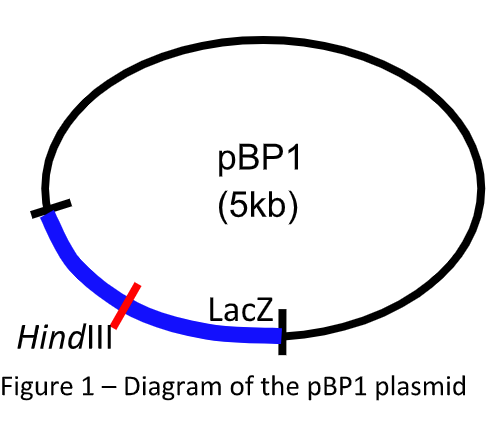
A circular bacterial plasmid (pBP1 shown in Figure 1) has a single HindIII restriction-enzyme site (red line) in the middle of its LacZ gene (blue box) that can be used for blue / white selection during gene cloning.
Fruit fly genomic DNA was digested with HindIII, and the genomic DNAfragments produced were inserted into the HindIII site of the pBP1 plasmid. Many different plasmid clones, each containing a different fragment of fruit fly genomic DNA inserted into the HindIII site, were produced. These
were transformed into bacterial cells and grown on agar plates producing blue and white colonies. Many white bacterial colonies were picked from the agar plate and analysed, each one containing a pBP1 clone containing a different fragment of fruit fly genomic DNA. Probing of the library revealed that clone 15 contains a specific fruit fly gene of interest (Gene X) inserted into the pBP1 plasmid.
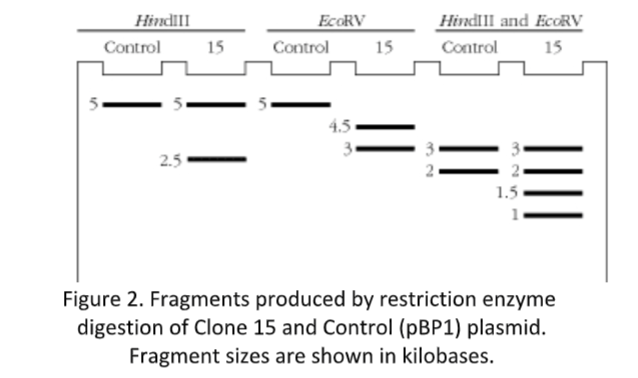
Clone 15 was studied further by restriction analysis using HindIII and another restriction enzyme, EcoRV. Clone 15 (pBP1 plasmid containing the fruit fly Gene X DNA inserted at its HindIII site) and Control plasmid (pBP1 plasmid without an insert) were digested with HindIII only, EcoRV only, or
with both HindIII and EcoRV together. The resulting DNA fragments from these digestions were separated on an agarose gel by electrophoresis, and the DNA bands stained with ethidium bromide. The resulting fragments, with sizes shown in kilobases, can be seen in Figure 2.
Questions to be answered in your report
- Discuss the process of blue-white selection in the above experiment, explaining what the purpose of the blue-white selection is, how it works, and what is indicated by blue colonies and by white colonies.
- Look at the HindIII only digestion results for both the Control plasmid and Clone 15 in Figure 2. Conclude what size (in kilobases) the Gene X DNA sequence must be and explain your answer.
- Look at the EcoRV only digestion results for both the Control plasmid and Clone 15 in Figure 2. Conclude how many EcoRV restriction-enzyme sites there must be in the Control plasmid, and how many EcoRV restriction-enzyme sites there must be in Clone 15, and explain your answer.
- Look at the HindIII/EcoRV double digestion results for both the Control plasmid and Clone 15 in Figure 2. Use this information to draw a map of Clone 15 (similar to the map of pBP1 in Figure 1) which shows the location of Gene X, the LacZ gene, the HindIII sites, and the
EcoRV sites, and gives the distances (in kilobases) between each of these restriction- enzyme sites. - If DNA from fruit fly Gene X was used to probe the bands in Figure 2, which of the bands would this probe detect (ie. which of the bands in Figure 2 contain the Gene X DNA sequence)? Explain your answer.
- If DNA from pBP1 plasmid was used to probe the bands in Figure 2, which of the bands would this probe detect (ie. which of the bands in Figure 2 contain the pBP1 plasmid DNA sequence)? Explain your answer.
DNA Fingerprinting (Q7-13 approx. 1500 words)
Experimental Outline and Data
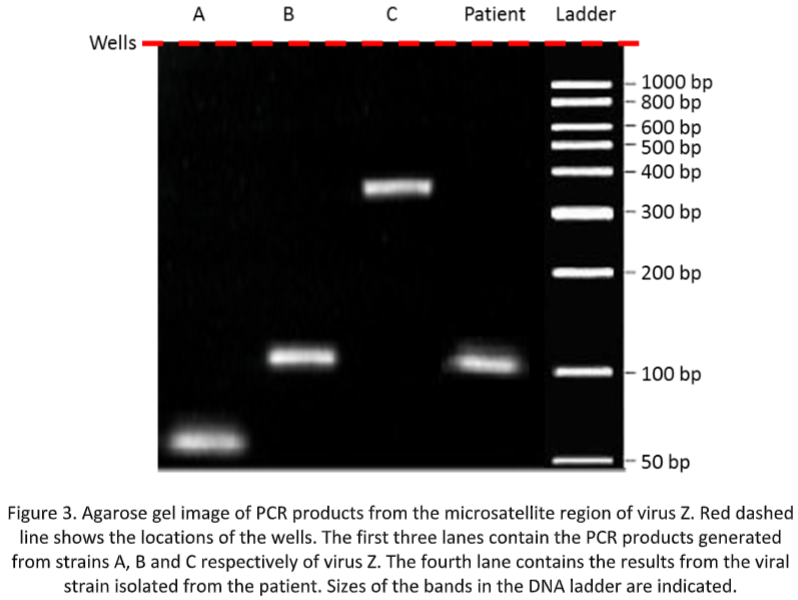
A patient is admitted to Luton and Dunstable Hospital exhibiting signs of jaundice and elevated serum aspartate transaminase and serum inflammatory markers are detected. Doctors suspect viral hepatitis and a blood test confirms the presence of a diagnostic coat protein for virus Z. Virus Z has three known strains that differ in their disease severity and prognosis. In order to determine the appropriate treatment to provide to the patient the precise strain of virus Z must be determined. The three strains can be distinguished by a PCR (polymerase chain reaction)
experiment that amplifies a microsatellite region within the gene encoding the viral coat protein. Each strain produces a PCR product of a different size, thus allowing the different strains to be identified.
The products generated from this PCR were separated by agarose gel electrophoresis and the band viewed under UV light after staining with ethidium bromide (see Figure 3).
Questions to be answered in your report
- Measure the migration distance (distance in millimetres from the wells to the bands) for each of the nine bands in the DNA ladder, and create a table of DNA band size, Log DNA band size, and migration distance.
- Plot a graph of Log DNA band size (bp) versus migration distance of band (mm), and add a linear trendline of best fit. Note: The calibration curve may be non-linear at high values for DNA fragment size.
- Use the trendline to calculate the sizes (in bp) of the PCR products generated from the reference strains A, B and C, showing your calculation. Note: One way to do this is to right click on the trendline in Excel and under options choose the “show equation” function. This will give you the equation of the trendline which can be used to calculate unknown band sizes from their known migration distance in figure 3.
- Use the trendline to calculate the size (in bp) of the PCR product generated from the patient sample (showing your calculation), and conclude which of the three strains of virus Z this patient is infected with.
- Explain what are DNA microsatellites, and discuss one example of a disease that is caused by alteration in a microsatellite sequence. Your answer should give details of the disease symptoms and presentation and should also explain how a change in a microsatellite sequence is believed to cause the disorder.
- In this study a single PCR primer pair was used to amplify a single microsatellite region of DNA from virus Z. However, different strains of virus Z showed different size PCR products. Discuss in detail how it is possible to obtain different sized PCR products from different samples when using the same PCR primer pairs. You may find it useful to use diagrams to illustrate your written answer (making sure that they are appropriately labelled and are referred to and explained in your main text).
- Discuss how microsatellite DNA in humans can be used to confirm the identity of a person’s biological father (paternity testing).
ORDER This BHS004-3 Restriction Enzyme Mapping & Forensic PCR Analysis Assignment NOW And Get Instant Discount