Module Code & Title :- BMG855 Operations Management
Assessment Type :- Assignment
The Paramount Diner :-
The case describes the Paramount: a 44-seat diner in the Beacon Hill neigh bour hood of Boston Massachusetts. The restaurant is a popular favourite among locals and tourists particularly for brunch on weekends when queues can stretch down the street. The case study focuses on the restaurant’s unusual seating policy and a recent increase in the popularity of carryout orders.
BMG855 Operations Management Assignment – UK

The purpose of this case study are threefold: firstly, to provide students the opportunity to practice basic process analysis concepts such as cycle time through put time input rates out put rates bottle necks and utilization secondly for students to consider the analytical and psychological dynamics of queues & operational transparency and thirdly to enable students to consider the inter relationships between the design of an operation and the corresponding behaviours of customers and employees.
The assignment requires students to complete the following five questions.
1) Essay on Theory of Swift Even Flow
Students should read appropriate material regarding the importance of managing flow and productivity. The key theory to investigate is TSEF Theory of Swift Even Flow. A list of books and articles have been suggested to get you started. Students should also perform key word searches to supplement the directed reading.
The objective of this scholarship is to help students to critically evaluate operations management relative to traditional management.
BMG855 Operations Management Assignment – UK
Suggested Key Words :
swift even flow productivity services manufacturing health care patient flow operations management.
You may want to combine a couple of these key words in your search using AND e.g. swift even flow AND productivity.
2) Process Analysis
a) Following the guidelines provided below conduct a quantitative analysis of the restaurant operation to identify the bottle neck in the process and to calculate how long customers might have to wait to be served.
b) Explain how the unusual seating policy is an operations management tool.
Cycle Times Bottle neck Identification & Flow Rate
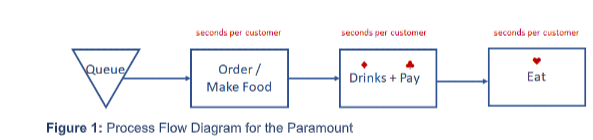
1.Using the Process Flow Diagram in Figure 1 and the information on page 3 of the case you should calculate the processing time for each of the three steps in seconds per customer
2.Note that there are two employees fulfilling drinks you are told how many seconds that one employee can fulfil a drinks order.
3.Note that there are 2.6 customers per party you are told how many seconds that the one employee taking payments can process per party. You’ll have to convert this to per customer.
4.You are told on page 3 how long in minutes that every table turns over.
You need to convert this table turnover time to seconds and then divide by the number of seats in the restaurant to calculate the seconds per customer. How ever you should assume only 80% of the seats are occupied by customers at any time. Therefore make sure to multiply the seat number by 0.8 before completing the calculation.
a.You should now be able to identify the bottle neck step in seconds per customer this is the cycle time of the process.
To convert cycle time into the Flow Rate that customers flow through the restaurant use the formula 1 / cycle-time. This will tell you how many customers per second are processed. Remember to multiply this by 3600 to convert the Flow Rate units into customers per hour. This Flow Rate in customers per hour can be used as the value of (service rate) for the equations in Exhibit 8 of the case study.
BMG855 Operations Management Assignment – UK
Customer Arrival Rates
Waiting time formulae are provided in Exhibit 8 of the case study.
Use Exhibit 6 to analyse the rate per hour that customers arrive. You should focus on the Saturday data as this is the restaurant’s busiest day. To start you off: between 7:30am and 8:30am 35+45 = 80 customers arrive. You can calculate the number of customers per hour for each of the hours up to 1:30pm.
Use Exhibit 7 on Customer Balking and Reneging to adjust your customer arrival rates To start you off: between 7:30am and 8:30am 15 customers either balk or renege.This means that between 7:30am and 8:30am 80 customers arriving – 15 customers balking or reneging = a net 65 customers per hour arriving. You can similarly adjust your calculations above for each of the hours up to 1:30pm. You could use a table like that in Table 1 below.
Table 1: Customers per hour arriving on Saturday
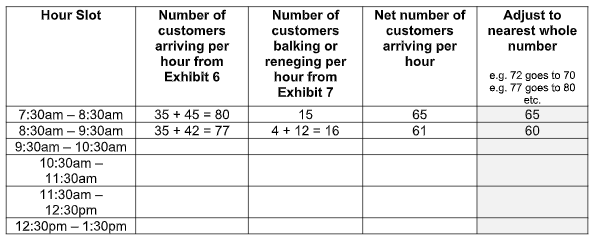
Once you have completed a similar table for yourselves choose the highest net customers arriving per hour value ◊ Table 1 column 5 for the calculations below.
◊ This value can be used as the value of customer arrival rate for the equations in Exhibit 8 of the case study.
Worker Utilization :
The Utilization equation is given in Exhibit 8 of the case study:
You can calculate Worker Utilization as you have already worked out and above.
Average Number of Customers Waiting for the Restaurant in a Queue
The equation for the average number of customers waiting for service waiting in a queue is given in Exhibit 8 of the case study: L q 2 / (1 –
1. Once you have calculated L q multiply this by 1.5 minutes per customer based on 90 customers per hour to calculate how many minutes the wait will be for each customer.
2.We are told on page 2 of the case study that the restaurant opens on a Saturday at 8:00am. Exhibit 6 tells us that there are 35 customers in the queue on a Saturday morning before the restaurant opens. Therefore you need to add this 35 to the L q value above and multiply this by 1.5 minutes per customer based on 90 customers per hour to calculate how many minutes the wait really will be for each customer on a Saturday.
Restaurant Customer Queue Length when Carryout Orders are Being Processed
If the Paramount can process 90 customers per hour let’s assume that Michael Conlon allows 10% of the customer orders to be carryout orders. This would mean that 9 customer orders per hour were for carryout food and 81 customers per hour could be processed in the restaurant.
1. Use 81 as the value of (service rate) and recalculate worker utilization
2. Use this new value of to recalculate the number of customers waiting in the queue L q
This will give you a good insight into the impact that accepting more carryout orders would have on queues at the restaurant.
3.Read the two articles referenced below which describe how customers in service industries introduce variability.
a) Use the knowledge acquired to discuss how customers introduce variability for the Paramount
b) Discuss whether the Paramount accommodates or reduces this type of variability.
4) Using the information from the case study and knowledge acquired from the calculations performed in part 1) students should consider the issue of carry out orders.
BMG855 Operations Management Assignment – UK

BMG855 Operations Management Assignment – UK
Your discussion should consider the following issues:
a) Where has the idea for carryout orders come from?
b) What are the business motivations for adding this type of service?
c) What impact will adding this service have on the restaurant customer experience?
5) Management Decision.
Advise the owner Michael Conlon as to the best course of action to take. You should choose between more carryout orders or less carryout orders. There are several reasons why you could justify either of these choices so your answer should describe what these might be.
It is expected that the overall written coursework will not exceed 4,000 words.
All published information that has been used in the preparation of the written assignment report should be properly referenced.
ORDER This BMG855 Operations Management Assignment NOW And Get Instant Discount