Module Name: Computational Intelligence
Module Code: COM3013
Maximum mark: 50 (50% of the whole module)
Assignment Type : Coursework 1
Note: Please do not copy from another student’s submission. All the other submissions are in the system and Turnitin will check for similarities. Coursework will be routinely checked for academic misconduct. Your submission must be your own work. Please read the Student Handbook to ensure that you know what this means.
COM3013 Computational Intelligence Assignment 1 – UK.

All functions in the DEAP library or PyTorch NumPy SymPy are allowed to be used for this coursework, and any other libraries within reason (e.g. for visualisation).
Please include your full name, URN and email address in the report. Use the IEEE template for conference papers:
Your report should be single-spaced, double-column (but tables or figures are allowed to span two columns if you wish).
Submit a single PDF file. The code you used to produce the results should be appended at the end of
the report (appendix). The appendix may be in single column format. Include a heading for each program in the appendix, i.e. one program for Q1.1, one program for Q1.2, etc. Everything should be pasted into one document, do not submit code as separate files.
The purpose of the coursework is to enable you to gain hands-on programming skills for using evolutionary algorithms to solve optimisation and learning problems.
Explain important hyper parameter settings you used, or any important changes to code that you needed to make.
1.For the following function:
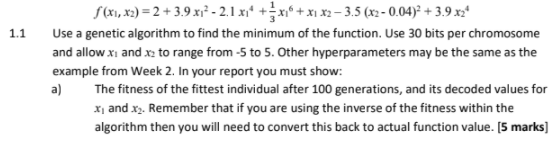
b) A plot of the fitness of the fittest individual across the generations.
c) A 3D surface plot of the function f across the range -2.1 < x 1 < 2.1, and -1.1 < x 2 < 1.1 (note this is just the scale of the plot. It is not asking you to change the bounds on x 1, x 2 in the GA), and a series of the fittest individual in each generation drawn on top of this plot, in black, with the final fittest individual in red.
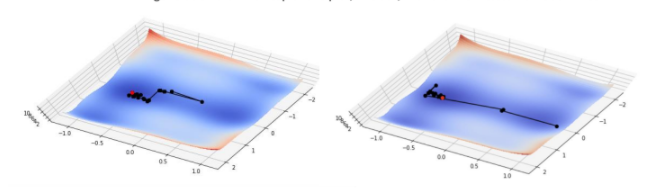
Here are examples of the expected output:
It is important to use a suitable viewing angle so that the points can be clearly seen (see Week 1 example). Note that due to the random nature of GAs it is possible that the initial population already has a best individual extremely close to the minimum (which means that the problem is already almost solved at generation zero). If this happens then run the GA again until you obtain a solution which shows a clearly visible improvement across generations, as in the above examples.
1.2 Write code to implement gradient descent for the same function f. Show the equations you derived for the slope of the function in each direction x1, x2. You do not need to spend a lot of time on formatting maths in your report; you could do it on paper and include a photo in the report, or do it with simple formatting like Q.3 below. Show a 3D surface plot of the function, with the series of improving solutions found during the descent (as in Week 1),from a suitable starting point (suitably far from the minimum). Show a second 3D plot to illustrate that a different starting point can lead to a different final solution.
COM3013 Computational Intelligence Assignment 1 – UK.
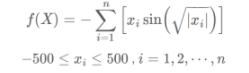
2.Find the minimum of the following function for 20 dimensions (n=20), using particle swarm optimisation
In your report you must show:
a) The fitness of the fittest individual after 400 generations, and its decoded value for all decision variables x 1 to x 20, using the canonical PSO.
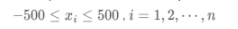
Note: your result should satisfy the constraint
b) A plot of the fitness of the global best individual across the generations, using the canonical PSO.
c) A plot of the fitness of the global best individual across the generations, using the social learning PSO (SL-PSO).
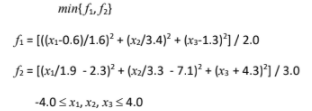
3.This task is to solve the following multi-objective optimisation problem using the elitist non-dominated sorting genetic algorithm (NSGA-II), using a programming language of your choice.
3.1 Encode the decision variables using Gray coding, each using 10 bits. Set the population size
to 24 and randomly generate an initial population. List the 24 initial solutions in a table in the following format:

Sort the solutions in the initial generation using the efficient non-dominated sorting.
NOTE: DEAP does not implement the efficient non-dominated sorting; to get full marks you need to code this yourself using the algorithm specified in the lecture (Week 4). List the solutions together with their front number in a table in the following format and sort them according to the front number in an ascending order. Print out the sorted individuals in objective values and front number. Also show a 2D plot of the solutions in objective space,indicating which solutions belong on the same fronts, e.g. by connecting them with lines. In your table highlight the worst objective value in f1: f1* = max{f 1 i}, i = 1, …, 24, and the worst objective value in f 2: f 2* = max{ f 2 i}, i=1, …, 24. f1, f2, front number
3.3 Calculate the crowding distance of each individual in the initial population. Add the resulting crowding distance of each individual to your table of 3.2 in the following format. f1, f2, front number, crowding distance
3.4 Apply tournament selection to select parent individuals for reproduction. Consider dominance and crowding distance in the selection. Create 24 offspring individuals. Select individuals for crossover at a probability of 0.9 and apply uniform crossover. Apply flip mutation at a probability that is inversely proportional to the length of the chromosome for each bit. Plot the 24 offspring individuals together with the parents in the objective space.Visualize the parent and offspring individuals using different colours.
3.5 Combine the 24 offspring individuals with the 24 parent individuals. Then select 24 individuals from the combined population using the crowded non-dominated sorting method. Plot the combined population (48 individuals) in the objective space. Highlight the 24 selected solutions using a different colour.
COM3013 Computational Intelligence Assignment 1 – UK.

3.6 Run the evolution for 30 generations by repeating the above steps. Calculate the hyper volume using the worst objective values ( f1, f2) obtained in Question 3.2 as the reference point (i.e. keep this as reference point for all generations) and plot the hyper volume of the non-dominated solutions over the generations. Note that hyper volume is a scalar value, so you are just plotting a scalar hyper volume value (y-axis) versus generation (x-axis), you are not asked to draw the hyper volume in f 1, f 2 space.Also plot (in a separate plot) the final generation of solutions in objective space, along with the reference point in a different colour.
Read More :

