Introduction :-
In this assessment you will need to perform an analysis of a dataset containing gene expression measurements. This dataset includes patients that have two different subt ypes of brain tumour. These datasets will give different results to the datasets used in the practicals. We are interested in finding biomarkers that will distinguish the subtypes using a data driven approach. In subsequent parts of the assessment you will use a similar dataset to generate biological networks and assess the enrichment of biological functions and pathways.
LIFE752 Computational Biology Analysis And Interpretation Assignment 1 RESIT – UK

The assessment contains a mixture of practical exercises and short answer questions. You should write your answers to the questions in a document that you will then submit at the end of the resit assessment period. There are 8 questions in total. You should not need to write lengthy essay style answers for the short answer questions most points should be addressable with one or two paragraphs. Please pay attention to the word limit for each question.
Consider when writing your responses that this is a scientific assessment and as such you should use appropriate terminology presentation of figures and/or tables and references.
Good to know: the data has been pre-processed and can be considered normalised & ready to use.
What you will need for this assessment:
1.To have an up-to-date installation of R and RStudio on your computer. To have installed and loaded all the packages we needed during LIFE752 practical’s 1 and 2.
Note: If you have trouble with R and R Studio on your computer or other general computer problems there are plenty of computers available on campus.
2.To have installed Cytoscape and the relevant plug-ins used during LIFE752 practical 3.
3.To download the data for the assessment from Canvas and place it in your current R working directory. More instructions below.
4.Access to the internet for the use of online web tools.
5.Access to Microsoft Word or equivalent software that can save files in MS Word format.
6.You may want to have access to software to aid with bibliography management and creation. There are numerous free alternatives, an example is Mendeley.
If you have problems accessing RStudio, Cytoscape, or the internet that cannot be fixed quickly let a member of staff know immediately.
Downloading the data:
The data and assessment instructions will be available to download via links on the assessment page on Canvas.
Writing your report:
1.Please remember that these reports should be anonymous to the markers so please do not include your name in your report.
2.For each question first write the question number such as Question 1 and then write your answer under neath.
3.For questions with a maximum word count, this does not include code, figure legends or any references you may want to include.
4.When a question asks you to perform an analysis that requires R code copy and paste the R code you used into your report even if the question does not explicitly ask for it. Part of the marks for these questions will be awarded for providing the correct code. If a question requires both code and a written answer put the code at the end of your answer for that question. Use the font courier new for the code. Indicate that it is code by changing the colour to red or blue, like this example:
here_is_some_code <- it_is_quite_readable(in_this_format)
5.Some questions will require you to save some of your work as images or take screenshots that can be pasted directly into your report. The easiest way to take screenshots is with a snipping tool which is available on both Windows and MacOS. It will be useful to familiarise yourself with this now if you can. This allows you to capture any part of your screen which can then be copy and pasted into your report. Alternatively you can take a screenshot of the entire screen and use other methods to crop the image. In any case you must ensure the figure has enough resolution for it to be assessed.
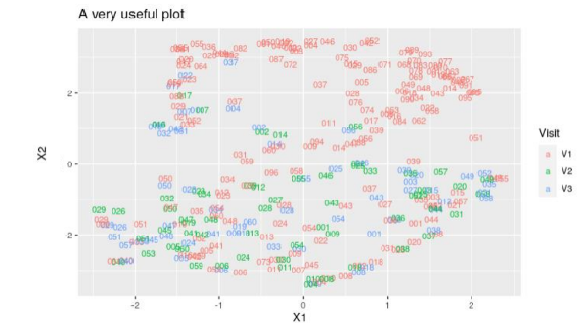
An example of a GOOD screenshot showing one out put with readable text
An example of a POOR screenshot (no cropping, text too small).
Submitting your report:
You should submit your final report in MS Word format using the resit assessment link on the LIFE752 Canvas page.
The questions will start on the next page.
Questions
The marks for each question are indicated after the question, the total is 100 marks.
LIFE752 Computational Biology Analysis And Interpretation Assignment 1 RESIT – UK
Section 1 – Data driven biomarker discovery – 65 points
For this section you will need to use two files:
Resit Part 1 Data set.csv
Resit Part 1 Meta data.csv
1.Using RStudio load the assessment dataset (ResitPart1Dataset.csv) and metadata file Resit Part 1 Meta data.csv and investigate the dataset:
a. How many samples and genes does the gene expression dataset have?
b. How many samples per sub type of disease does the data have? Tip: you can use the meta data file
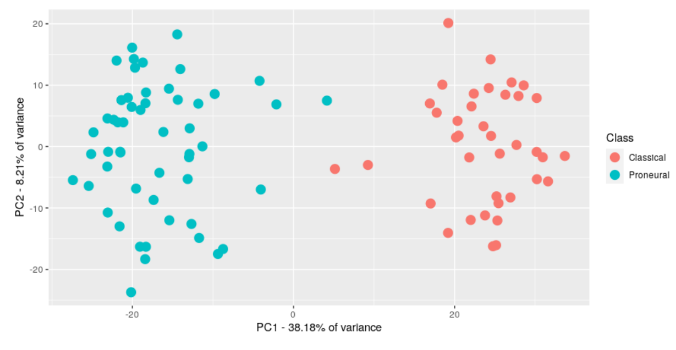
2. Under take principal component analysis (PCA) on the data. Produce a plot of the first two principal components (PC1, PC2). Colour the samples based on the tumour subtype using any two colours you like and add the plot to your report. Note: you should annotate your plot with any other detail you think is relevant for example the % of variance explained.
3. Answer the following questions regarding the interpretation of the PCA plot You may combine your answers into one section of text.
If you have not managed to generate a PCA plot you can use the plot on page 6 to answer some of the points.
i. Explain in 2 or 3 sentences what is the purpose of a Principle Component Analysis.
ii. What is represented on the x- and y-axis of the plot.
iii. Discuss in a few sentences what this plot tells you about the data.
iv. Describe what you could learn from the principal component loadings.
v. Use the principal component loadings to select the top 5 most contributing genes to the structure observed in the score plot. Report your code and the 5 genes selected.Briefly describe whether any of these genes have known links to brain tumours. And if not are they involved in biological functions that are important for cancer biology? Discuss one or two of your findings.
4.Using what you learned in practical 2 section 5 onward use a back wards elimination algorithm to select the most important genes that separate the two types of tumours.
Note: Please run the code set.seed(800) before you under take this step Build a random forest model using only the selected genes from the back wards elimination process. Report your code and answer the questions below.
LIFE752 Computational Biology Analysis And Interpretation Assignment 1 RESIT – UK
i. What is the accuracy, sensitivity, and specificity of your model? You may want to include a screenshot of the results of the summary function.
ii. How many genes are selected?
iii. Is this a good model? discuss the performance of the model and whether that performance is different for each class.
5.Answer the following points related to potential further analysis of this data set. You may combine your answers into one section of text.
I. If you were planning to reduce the number of genes for further study how could you achieve this using alternative computational biology approaches?
II. Not all genes will make good biomarkers, briefly discuss in your own words what you think is the definition of a good biomarker.
III. Can you find any evidence in the literature that the genes selected by your back wards selection algorithm are related to biological functions that could be important discriminators of the two types of tumours? Discuss your most relevant findings.
IV. A computational biology analysis of a single dataset has serious limitations when it comes to establishing widely used biomarkers. What further steps would you suggest in order to increase our confidence that the biomarker candidates are reliable.
LIFE752 Computational Biology Analysis And Interpretation Assignment 1 RESIT – UK
If you did not manage to generate the PCA plot in question 2 you can use the plot below to answer question 3.
Section 2 – Biological networks and pathway analysis – 35 points
For this section you will need to use one file:
Resit Part 2 Data set.txt
6.Using Cyto scape and the information from workshop 3 construct a correlation network using the gene expression data set you downloaded from Canvas (ResitPart2Dataset.txt). This could involve the following steps:
a. Load the nodes and gene expression data into Cytoscape
b. Use the Cyni tool box plug in to create a correlation network with the following settings:
1. Inference algorithm: Basic Correlation Inference
2. Threshold to add new edge: 0.7
3. Type of correlation: Positive
4. Metric: Spearman Rank Correlation
5. Use all samples
Use the information and tools within Cytoscape to answer the following questions:
A. How many nodes does your network contain?
B. How many edges does your network contain?
C. What is the average number of neighbours/edges per node?
D. What is the name and degree of the gene with the highest degree?
E. Colour code the genes in your network by degree, then take a screenshot of your network and include it in your report (take a screenshot anyway even if you can’t apply the colour coding).
LIFE752 Computational Biology Analysis And Interpretation Assignment 1 RESIT – UK

7.Using the same network you generated in question 6, apply the Community cluster (GLay) algorithm. Make sure that you tick Create new clustered network before clicking OK. Use the genes in the two largest clusters to perform an analysis using the DAVID web tool. Now answer the questions below:
A. How many of the clusters in your network contained more than 30 genes?
B. Briefly describe the advantages of performing a network clustering analysis
C. For each of the two largest network clusters, what were the 5 most significant categories from the DAVID analysis?
D. If you were to include your results from DAVID in a publication, how would you select the categories to report and why (max 200 words)
E. Include a screenshot of your clustered network and your DAVID analysis results (do not include multiple screenshots from the same DAVID analysis, just the top of the results table is fine)
8.Explain in your own words why you think network based approaches are effective when learning about biological systems. You may want to describe a few examples of properties of biological networks to support your answer.

