Unit Title : Sales Planning And Evaluation
1.Building an IT-solution to perform a plan-fact analysis of bike production company sales to shop buyers
1.1. Description
The main learning objective of this assignment is to apply knowledge of SQL and foundations of relational databases to create a simple IT-solution for plan data management.
You have been given access to a database of a company that sells bikes and related products.The database contains information about orders, products, and customers. Customers of two types place orders – individuals and shops (reseller companies).
Sales Planning And Evaluation Assignment-UK.

To evaluate the performance of sales department you need to (1) create tools to automate the planning process and (2) prepare data to calculate difference between planned and actual values of amount sold to companies.
Data manipulations should be implemented in SQL. Plan management (like creating new plan periods, data approval or changing planning status) needs to be done in form of python function calls.
This assignment includes the following activities:
• Writing queries to process and copy data
• Creating functions in python that uses one or more SQL queries
• Creating materialized views in SQL
• Setting permissions with SQL
A more detailed explanation of planning process is presented in the sections below. The next chapter covers users of a planning system you are creating and their role in planning process.
1.2. Users of planning system
There are two user groups working with plan data: administrators and managers.
Administrators prepare initial plan data which then becomes available to managers. One planning period stands for one quarter. Administrators have access to all plan data unlike managers.
Managers plan sales in several countries. Mapping between countries and managers is documented in the system’s settings. Once the administrator has prepared the initial version of sales plan, managers will be able to update and approve the calculated figures. The initial sales plan is based on actual data in two previous years.
Managers can lock their data to avoid unintended corrections by other users. Only locked data is available for correction.
At the end of the planning process managers confirm correctness of plan figures. The approved plan is then used to prepare a report on plan-fact deviations. Plan-fact comparison report is available to both managers and administrators.
1.3 Implementation of the planning process in a database
To organize planning process special tables were designed to store planning data as well as information on its status on a given planning period.
Plan data has three versions stored in a single table – N (initial calculation), P (edited) and A (confirmed and considered as the result of planning).
A plan data slice is defined by a quarter (e.g., 2013.3) and a country. The status of each data slice can be set individually. The valid status values are R (ready for work), L (locked by manager and available for editing), A (approved).
This list contains an example of operations performed on plan data:
• The planning period (quarter and year) is defined
• The administrator creates current planning period records with an R status for each slice of plan data. If there are 6 countries, then 6 records will be added.
• Initial plan calculation is performed, and the results are saved as an ‘N’ version. Version N is not changed afterwards.
• Plan data is copied from N to P version. The only difference between these versions of a plan is only the version name
• Managers change P version of plan data after changing the respective slice status from R to L. If the data was locked by another person before, then editing is impossible.
• Managers release locks on their data. Removing data locks means changing data status from L to R. The lock can be removed only if the slice status is L and the author of last changes is the current user.
• Then the data is copied to the ‘A’ version by managers which means that the plan data is approved. The respective status records of data slices are changed from R to A. Data in the ‘A’ version is then used to prepare a report on differences between planed and actual sales amount.
1.4. Calculating the initial planning values
To evaluate the expected volume of sales to shops, you need to use actual sales to customers,which make the most of total yearly sales to companies (not individuals).
Company (shop) grouping is conducted with help of ABC-analysis based on sales data of each year. Only A and B groups of customers are used to prepare the initial plan data.
The planning year is further denoted as y.
To determine the initial target sales amount, it is necessary to calculate the quarterly sales amounts in y – 1 and y – 2 years (excluding customers in the group C) based on planning period,quarter and year of fact data, country and product category. Then calculate quarterly averages for each combination of planning period, country and product category.
The administrator saves the initial data as an ‘N’ version of the plan. The same data is copied to the ‘P’ version which is supposed to be edited by the managers.
For example, the calculation in the first quarter of 2020 for bikes in US will require data in first quarter of 2018 (2018Q1_US_Bikes) and the first quarter of 2019 (2019Q1_US_Bikes). The result of calculations will be equal to (2018Q1_US_Bikes + 2019Q1_US_Bikes)/2
1.5. Company classification by annual orders
The assessment is done quarterly in terms of product categories and the countries in which the stores are located. In this task the planning year is 2014.
It is necessary to split the buyer companies into three groups by their volume of orders in y – 1 (2013) and y – 2 (2012) years. As a result, two ratings of companies (for each year) will be created. The following algorithm should be used to define members of the three groups for one year:
- Calculate the total value of sales to companies before taxes. This value is denoted as S
- Calculate the upper boundary values for inclusion in the groups A and B: Sa = 0.8 * S, Sb = 0.95 .S
3.Make a rating. Sort companies in descending order by the total value of the orders made (STi).
4.Apply running total calculation to STi in the result set of the previous step. The new column is denoted as SRTi. SRTi of a single company in this case equals the amount of orders of this company i plus sales of all companies that are higher in this rating
5.Rank the company i according to the following conditions:
a. If SRTi does not exceed Sa, then the company is marked as A
b. If SRTi does not exceed Sb, then the company is marked as B
c. In any other cases mark the company as C.
1.6. Comparison of planned and actual sales
As soon as a manager has finished editing the plan and approved it, the data becomes available for plan-fact analysis.
The plan-fact analysis report uses only those plan values that are marked as approved by the manager.
Comparison of planned and actual values is made in terms of year, quarter, country, and product category. Actual figures are taken from the information about sales in the y year to shops that were members of groups A or B in the y – 1 year.
If the planning period is the 1st quarter of 2020, then the actual data will be selected from the 1st quarter of 2020 for companies that were in groups A or B as of 2019.
A report template is shown below:
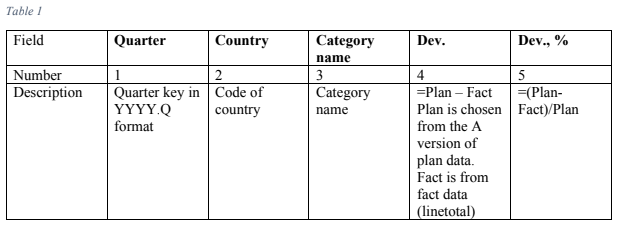
If the approved plan data cannot be found, then null should be shown in cells 4 and 5.
About this task
2.1. Instructions
While preparing this assignment you will modify access settings and write SQL code to manage plan data and create additional database objects. Then you will develop several Python functions to automate activities related to the manipulation with plan data.
The code written will be used to prepare a plan for the first quarter of 2014. The final step includes comparing planned and actual sales figures.
Sales Planning And Evaluation Assignment-UK.
2.2. How to submit
To get mark for this assignment you need to prepare two files and upload them to the platform.
Create a report in docx format. Every task includes a hint on what should be put in the report.
For example:
Add ‘Confirmation of Plan Data’ to the report. Insert the function code into this chapter.
- After you are done with the whole assignment generate your database dump file with pg_dump and submit it with the report.
2.3. How this assignment will be graded?
This assignment has 9 tasks. Instructions begin on page 8.
First, the completeness of the report is considered. To get a high score, all results marked with color and italics must be present in the report and well formed.
The backup should include all the results mentioned in the report. Code from the report should align with requirements written in this document.
Develop functions and queries that are compatible with the database. You get 1 point for tasks 1, 2, 3, 5, 7, 8 and 2 points for 4, 6, 9.
Sales Planning And Evaluation Assignment-UK.
3.Before you begin
Make sure, you have installed Postgres 11 or later. You will also need a client software to communicate with the server (for example, DBeaver).
Find files with the following titles (attached to this course):
• FT. Database backup – backup database with business data
• FT. Tables, views and roles – DDL to create additional tables, views and roles
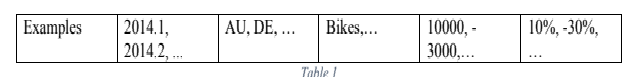
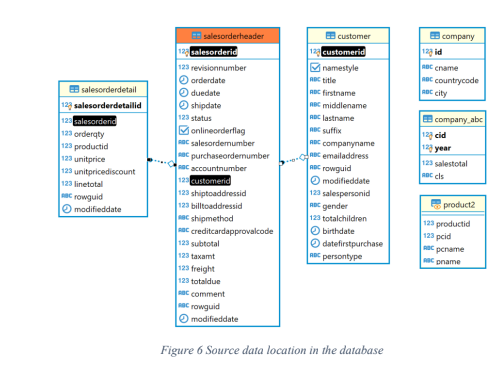
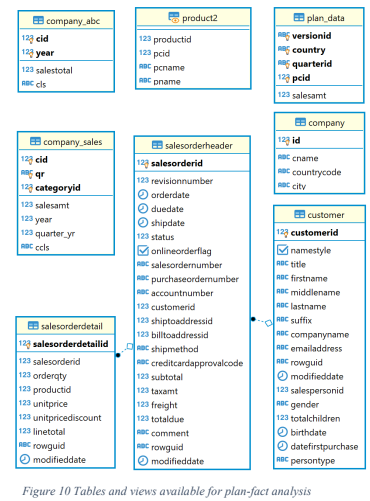
Restore the database on your server and name it like plans. E.g. 2020_plans_Kirill. In case of success your database will contain tables as shown on the diagram below (Figure , page 7).
In addition to the tables in the diagram, you will need tables and views below, which should be added from the corresponding file with DDL. Run code from the file to create the following database objects:
- Table which stores status of plan data fragments – ‘plan_status’
- Table of versioned plan data – ‘plan_data’
- Data access settings defining each manager’s permissions to view and edit sales plans in specific countries – ‘country_managers’
- Table of customers which are companies. Shops that resell products – ‘company’
- Aggregated sales table in terms of companies, product categories, years, and quarters – ‘fact_sales’
- Company classification by total annual cost of orders – ‘company_abc’
- A view for managers to edit planned data – ‘v_plan_edit’
- A view to read approved planning data based on user’s permissions – ‘v_plan’
- Two roles – planadmin (administrators) and plan manager (managers).
- Graded tasks
Sales Planning And Evaluation Assignment-UK.
4.1. Task No1. Creating users and setting up data access rights
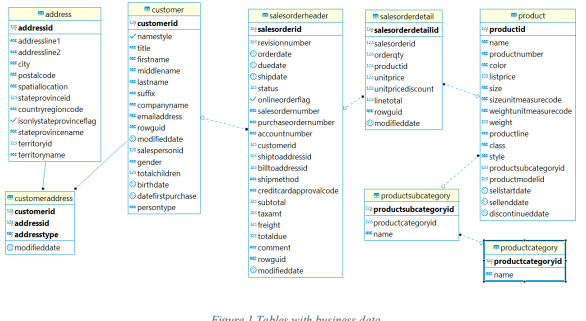
Set up permissions for roles as written in the table below:
Legend:
S – select
U – update
I – insert
D – delete
Create three users:
• Administrator:
o ivan
• Managers:
o sophie
o kirill
Manager sophie has access to data of US and CA countries. Manager kirill works with sales data in FR, GB, DE, AU countries. Put this information in the ‘country_managers’ table, which stores data about the anchoring of managers for certain countries.
Add the settings script to the report under the heading ‘Task No1. Access settings’. Insert a query\queries into the report to put the data in the ‘country_managers’ table.
Sales Planning And Evaluation Assignment-UK.
4.2. Task No2. Creating product and country views
For convenience, add two materialized views – ‘product 2’, ‘country 2’.
The ‘product 2’ view should contain the product and its category.
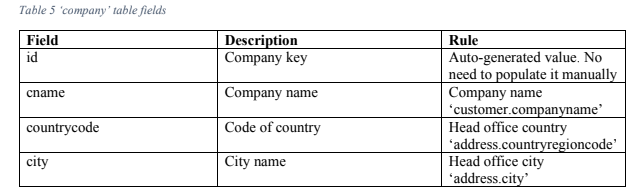
The ‘country2’ view should be filled with unique codes of the countries where the shops are located (the type of address is Main Office).
Allow managers and administrators to read from these views.
Fields of ‘product 2’ are shown in the table:
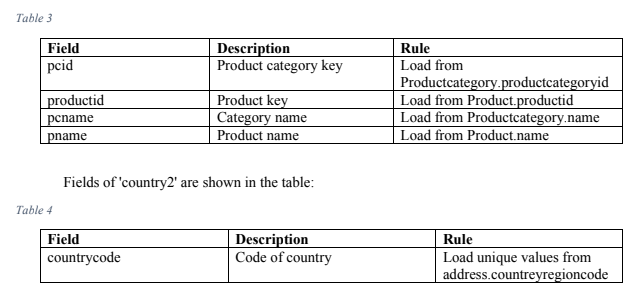
Add sql code of the views into the report under ‘Task No 2. product 2 & country 2 materialized views’ heading. Also add commands to set necessary permissions.
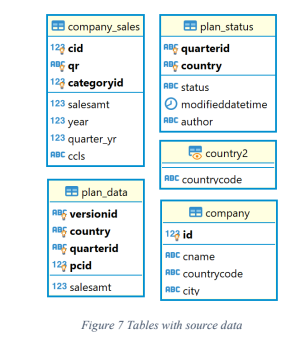
Tables with source data
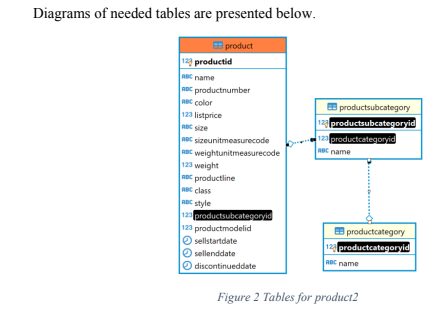
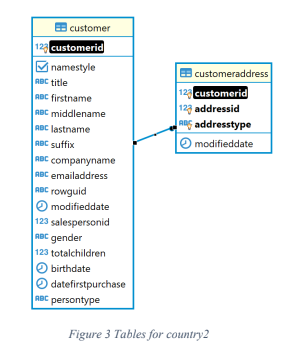
Diagrams of needed tables are presented below.
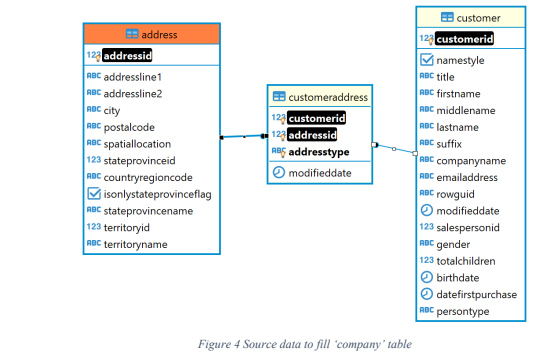
4.3. Task No3. Loading data into the company table
In the current database the customer table contains information about two categories of buyers individuals and companies. However, we consider only companies. For the convenience of further development, fill the company table with data.
Data from the company name field should be included in the list of companies. The country and the city should be taken from the address table. Develop a query to load the country table.
Sales Planning And Evaluation Assignment-UK.
Follow these rules in the table below. Use an addresses of ‘Main Office’ type to find the appropriate information.
Include the prepared query into report under the heading ‘Task No3. Loading data into the company table’
Tables with source data :
The following tables can be used to form the ‘company’ table: customer, customer address, address. Find them on the diagram.
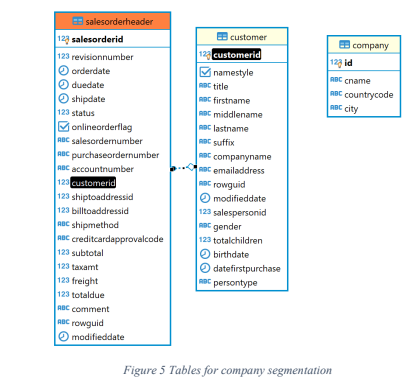
4.4. Task No 4. Company classification by annual amount of orders
Split the companies into three groups according to algorithm in section 1.5 (on page 5) for 2012 and 2013.
Fill in the ‘company_abc’ table using SQL query. All calculations should be done in one query.
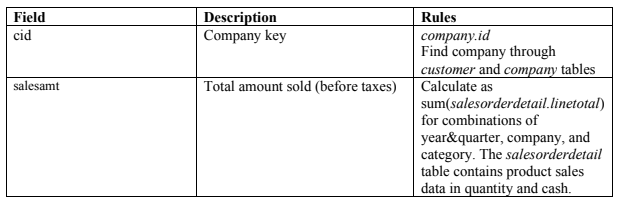
Table 6 company_abc’ attribute loading rules
Sales Planning And Evaluation Assignment-UK.
Add the designed SQL queries to the report under ‘Task No4. Company classification’ heading. Add a screenshot of 10-20 records of company_abc.
Tables with source data
Use the following tables:
sales order header, customer, company
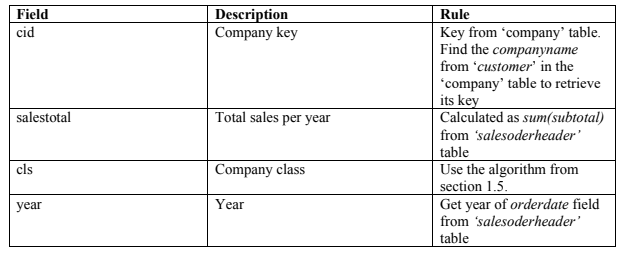
4.5. Task No5. Finding quarterly sales amount by company, and product category Calculate quarterly sales amount before taxes in 2012 and 2013 individually. Fill the company_sales table using data about orders, companies, and classification results in the respective year.
The table below contains comments on filling the fields of the company_sales table.
Table 7 Data loading rules for company_sales table
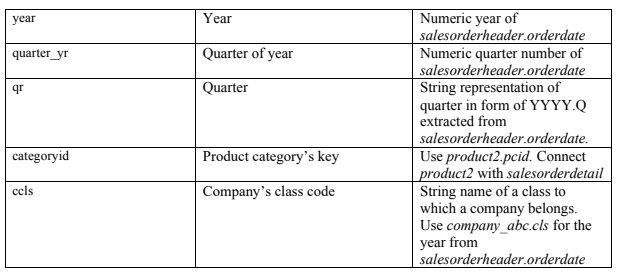
Add your query into the report under “Task No5. Finding quarterly sales amount by company, and product category” heading
Source data
Use the following tables and views to complete the task:
Customer, company, company_abc, sales order header, sales order detail, product 2
4.6. Writing functions to automate planning process
Now it is necessary to write python code. You can use the same file to develop functions and execute them. Call con.commit() at the end of processing to apply changes after you execute SQL commands. The con variable here is a connection in psycopg2 library. If you do not add this instruction,then the data will be left unmodified.
Sales Planning And Evaluation Assignment-UK.
4.6.1. Task No 6. Generating the initial planning data
Write a function in python to help managers start working with plan data. Parameters of the start_planning(year, quarter, user, pwd) function are:
• year – target year of planning period
• quarter – target quarter of the planning period
• user – database username
• pwd – database user’s password
These parameters have the same meaning in the next tasks.
The function should implement the following steps:
1.Delete plan data from the plan_data table related to the target year and quarter. In the plan_status table delete records related to the target quarter
2.Create planning status records (plan_status table) for the selected quarter. The number of records added equals the number of countries in which customer-companies (shops) are situated.
3.Generate version N of planning data in the plan_data table. Use the calculation algorithm is described in section 1.4. on the page.
4.Copy data from version N into version P in the plan_data table.
Name of the current user who called the function should be stored in the records of plan_status table.
If initial planning data cannot be generated for some record in plan_status (e.g., if no data can be found in the company_sales table), then add rows with 0 in sales amt column for related combination of country and category.
Sales Planning And Evaluation Assignment-UK.
If the function works correctly, the data will appear in the plan_data and plan_status tables.The N and P versions of plan data will be created.
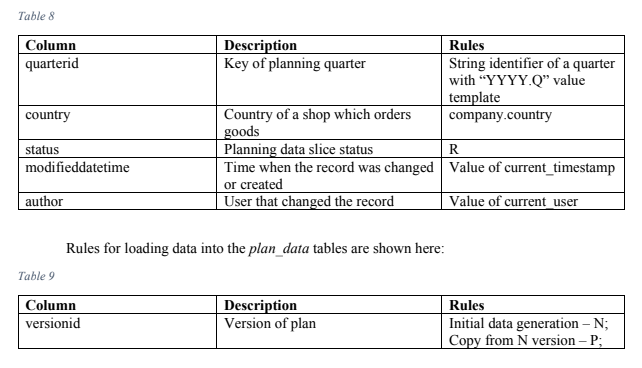
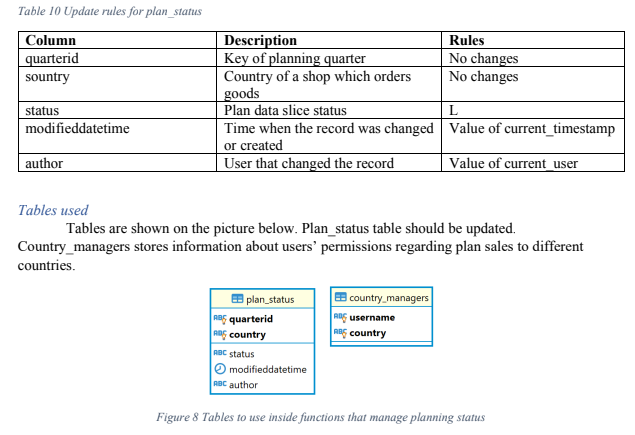
Rules for loading data into the plan_status tables are shown below. Plan_status holds information about all plan data slices, which are restricted by quarter and year and country:
Call this function on behalf of ivan. The target planning period is 1st quarter of 2014.
Add the start_planning function to the report under a new header – “Task No6. Initial data preparation”.
Write a line with function call that you used to populate the plan_data and plan_status tables. Add two
screenshots of plan_data and plan_status contents, showing results of the function execution (P and N
versions of plan should exist, status should be equal to R).
Source data
4.6.2. Task No7. Changing the plan data
Write two functions in python:
• set_lock(year, quarter, user, pwd), which will change status from R to L for data slices, that are associated with the target quarter and year, and connected to the current user in the country_managers configuration table. To obtain the name of the current user, use current_user. Also write a timestamp of modification to the modified date time field.
• remove_lock(year, quarter, user, pwd) function, that will change the planning data status from L to R. associated with the current user through the country_managers table. Write a change time stamp in the modified date time field.
Execute the set_lock function to lock the plan data for the 1st quarter of 2014 on behalf of“kirill” user, and then – “sophie”. If everything is done correctly, data will appear in the v_plan_editview if connected as kirill or sophie.
Increase planned sales by about 30-50% in the v_plan_edit view on behalf of two managers.You can edit data through the view in DBeaver using a virtual key (it must contain all fields except sales amt).
Run the function remove_lock to mark Q1 2014 as not in use. Run this function as “kirill” and then as “sophie”. Now the v_plan_edit view will return no records.
Add set_lock and remove_lock code into your report under “Changing plan data” header. Also provide a screenshot of v_plan_edit contents when logged in as kirill. The screenshot should show the changed data before executing the remove_lock function.
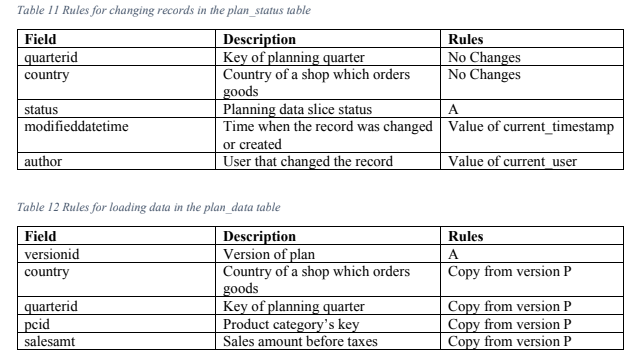
Rules for updating the plan_status table are listed below:
4.6.3. Task No 8. Plan data approval
Write a function in python – accept_plan(year, quarter, user, pwd). The function is designed to copy the corrected data into the actual version of the plan.
The function should select records from plan_data table that meet the following requirements:
• Planning quarter (quarterid column) is equal to combination of year and quarter from the function’s arguments.
• Version is ‘P’ (corrected version of the plan).
• Data slice status (in plan_status table) equals ‘R’.
• The current user has a permission to access the plan data according to the settings in the
country_managers table.
Implement these processing steps in the accept_plan function:
• Clear the A version of plan data for specific quarter and countries accessible to the current user
• Read data available to the current user from the version P and save its copy into as the version A
• Change the status of data being processed from ‘R’ to ‘A’
When updating the status, also save a time stamp in modified time stamp column. Use the developed function to approve the plan of Q1 2014 on behalf of each manager. Check whether the data is visible through the v_plan view:
• The administrator has access to the entire plan
• Manager can view only data he/she is permitted to read and change.
Add accept_plan function code to the report under “Plan data approval” heading. Also include a function call as kirill and sophie. After logging in as sophie add a screenshot of rows in the v_plan view.
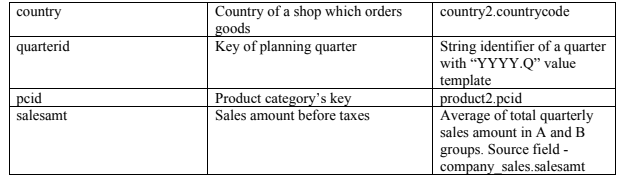
The next two tables represent comments on how to update plan tables.
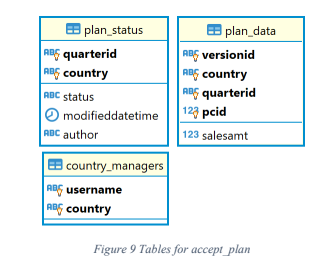
Tables used
Tables are shown on the picture below:
4.7. Task No 9. Data preparation for plan-fact analysis in Q 1 2014
Create a materialized view mv_plan_fact_2014_q1 to compare planned and observed sales before taxes in 1st quarter of 2014. The view itself should show the difference between fact and plan.
The report requirements are described in the section 1.6.
Use the results of ABC-analysis from 2013 to find actual sales of A- and B-class companies in 2014.
You can choose one of these approaches (does not affect your grade):
1.Load data of 2014 into the company_sales table and include this table in the view
2.Calculate actual data using sales order header and order sales detail tables without using
Add a header “Data preparation for plan-fact analysis in Q1 2014”. Write which approach you chose.Include SQL code of the new materialized view together with a screenshot showing data in mv_plan_fact_2014_q1 view.
Tables used
Here you can find all tables and views that can serve as a data source for the considered report.
Database submission
Use backup instruments to prepare a dump file.
Attach the dump file and the report to the assignment’s prompts. Created database should meet the requirements presented in your report – contain necessary tables with data and views.
Python functions and SQL queries provided in the report are expected to run successfully with your database.
ORDER This Sales Planning And Evaluation Assignment NOW And Get Instant Discount

Read More :-

