Subject Code & Title: ST104a Statistics
In this exercise you will practice interval estimation by constructing confidence intervals and considering sample size determination, as well as hypothesis testing. Question 1 is a confidence interval for a single mean with σ known. Question 2 involves a hypothesis test for a single population mean, and Question 3 involves a hypothesis test for a single population proportion. Questions 4 and 5 relate to testing the equality of two means (think whether the samples are independent or paired), and finally Question 6 is a test of the equality of two population proportions.
ST104a Statistics Assignment Exercise 3 – UK.

1.A simple random sample of 225 workers in a large factory had weekly salaries with a sample mean of £600 and a population standard deviation of £30.
(a) Calculate a 99% confidence interval for the mean weekly salary of all workers in the factory.
(b) How many more workers should be sampled if it is required that the estimate must be within £3 of the true average (again, with 99% confidence)?
Hint: This means a tolerance of £3 – equivalent to a confidence interval width of £6.
2.A random sample of 17 observations from the population N(μ, σ2) yields the sample mean ̄x = 6.73 and the sample variance s 2 = 1.23. At the 1% significance level, test the following hypotheses by obtaining critical values:
(a) H0 : μ = 6 vs. H1 : μ > 6.
(b) H0 : μ = 6 vs. H1 : μ < 6.
(c) H0 : μ = 6 vs. H1 : μ 6= 6.
Repeat the above exercise with the additional assumption that σ 2 = 1.23. Compare the results with those derived without this assumption and comment.
3.A UK government agency carries out a large-scale random survey of public attitudes towards job security. 104 of the 400 workers surveyed indicated they were worried about losing their job. A newspaper report claims 30% of workers fear losing their job. Is such a high percentage claim justified? State and carry out an appropriate hypothesis test at two appropriate significance levels and explain your results.
ST104a Statistics Assignment Exercise 3 – UK.

4.A company wants to check the quality of its customer service regarding phone enquiries. For this reason, the manager wants to compare the call waiting times during the years 2020 and 2019. Unfortunately, extensive records of the company are not available, and he can only check a random sample of phone calls within these two years. The available data, measured in minutes of waiting time, are provided below for each year.
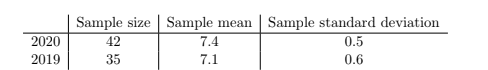
(a) Use an appropriate hypothesis test to determine whether the mean waiting times were different between these two years. Test at two appropriate significance levels, stating clearly the hypotheses, the test statistic and its distribution under the null hypothesis. Comment on your findings.
(b) State clearly any assumptions you made in (a).
(c) Adjust the procedure above to determine whether the mean waiting time in
2020 was greater than in 2019.
5.A study was made to determine the amount of fuel economy obtained by using a specific new type of tyre over a standard type. For this reason, 8 cars were fitted with the new type of tyre and the fuel consumption (in km/l) was measured after a test drive. Afterwards, the same cars with the same drivers were fitted with the standard type of tyre and the experiment was repeated to obtain the following fuel consumption measurements.
(a) Carry out an appropriate hypothesis test to determine whether the fuel consumption is different between the two types of tyre. State the test hypotheses, and specify your test statistic and its distribution under the null hypothesis. Comment on your findings.
(b) State any assumptions you made in (a).
(c) Give a 95% confidence interval for the difference in means.
(d) On the basis of the data alone, would you be concerned about fuel consumption if you wanted to buy the new type of tyre? Provide an explanation with your answer.
ST104a Statistics Assignment Exercise 3 – UK.

6.A survey is conducted to compare public attitudes towards local policing. A number of people in two areas of interest are sampled, and asked if they are satisfied with their local police–community relationship. The results of this survey are shown in the following table.

(a) You are asked to consider an appropriate hypothesis test to determine whether there is a difference between the two areas in the proportion who are satisfied. Test at two appropriate significance levels and comment on your findings. Specify the test statistic you use and its distribution under the null hypothesis.
(b) Compute a 98% confidence interval for the proportion of people in Areas A and B combined who are satisfied, assuming the respective sample sizes are proportional to population sizes.
ORDER This ST104a Statistics Assignment Exercise 3 NOW And Get Instant Discount