Unit Title :- Statistics And Data Modelling
Assessment Type :- Assignment
Assessment 1 will be a recorded individual presentation. You must select from one of the data sets listed below and provide an analysis using this dataset. You are then to present this using Microsoft Power Point or other equivalent presentation software. Your presentation must be no longer than 15 minutes. We have selected six sample datasets. You must only choose ONE of these datasets to perform your analysis on. What you perform is your decision but your presentation must cover the following points:
Statistics And Data Modelling Assignment
1. Statement of hypotheses
2. Description of the data & Descriptive analysis
For those aiming for a higher classification in this task should in addition consider covering:
3. Inferential analysis
4. Results & Implications
More detail of the above points is provided below.
1. Statement of hypotheses
In this section you are required to think creatively and create your own set of hypotheses that you wish to test. This is your opportunity to put your knowledge into practice. It allows you to apply theory you have learned potentially previously. It can also encourage you to think about how you can use financial and accounting data. For example are wages higher for people with more education? Are bitcoin returns equal to zero? What determines CEO salaries? These are example research questions that you can test via establishing a set of hypotheses and running a process of empirical analysis. However feel free to explore your own question(s). This is informed by Topic 3.
2. Description of the data and Descriptive Analysis
For this section you must ensure you tell the audience about.
– The nature of the dataset (i.e. cross-sectional, time-series)
– The nature of the variables (i.e. continuous, ordinal, categorical)
This section will require you to do some work in R.
Each of the datasets are different so the descriptive analysis will also be very different. Think about what the most appropriate way to present your data is. You can provide a range of tables plots histograms to explain what the data shows and the composition of the data and its variables, as covered in Topic 2.
Statistics And Data Modelling Assignment
3. Inferential analysis
In this section you may wish to try and test your hypotheses. Using the R commands covered in Topic 3 to 5, you can think of ways to perform inferential test(s). This may be with a regression analysis (lm()) or it could be with a t-test (t.test()) for example. This will be defined by what your research question(s) are and thus your hypothesis testing. You should attempt to present what your model is and your variables. Be clear where and why you have transformed the data (i.e. subsetting).
4.Results & Implications
For example you may wish to attempt to answer the following:
What are the results and the qualitative interpretations? For example, this would be an explanation of your t-test and/or regression results. On what basis can you reject/not reject the null hypotheses? What are the implications of these results and how do they inform the research questions? For example wages are estimated to be higher where an individual has higher levels of experience. Think about the most illustrative way of presenting the results.
How you format your presentation and how you present each of the above points is up to you! This is your creative decision to make. Use the tools we have learned in R to explore the data think about a research question and perform some tests to support a range of hypo theses you set your self. More detail on the data sets you can choose from is provided on the following page:
Datasets
1.Wages
This type of dataset is familiar from IT labs. We have provided an extended version here which has additional variables. A common question here would be to try and test hypotheses related to how much people earn. This could be as a simple t – test (Do X earn more than Y) or something more complex. You could wish to construct a multiple regression which allows you to test wages for multiple variables. This may be of more interest to students who have a more general interest in the wider economy. Those working in accounting often need objective models for wages to determine a market value for employees.
2. Ethereum
This dataset is very simple. There are only two columns, dates and closing prices of Ethereum the 2nd largest Cryptocurrency after Bit coin). However do not let this fool you. A typical question here could be to look at the average return over different periods or you could simply try to test if the mean return is equal to zero remember this is what the theory says it should be! similar to what was achieved in IT Lab 3.1 with Bitcoin data. This is an exceptionally interesting area of research but challenging for those who wish to push their skills in R.
Statistics And Data Modelling Assignment
3.Capital Asset Pricing Model
This dataset is a CLASSIC in finance research. The capital asset pricing model (CAPM) is an important model in the field of finance. Attempting to model stock returns is perhaps the ONLY thing people are really interested in finance both in research and in industry. In this dataset you can test the CAPM model that you may have learned about in your other modules. You will develop a much greater under standing of how risk metrics (Beta) are calculated and this will no doubt be helpful for you in the future. However bear in mind this can also be a tricky dataset to work with. Topic 4 is useful for this.
4.CEO Salaries & Firm Performance
CEO salaries are hotly discussed in news and media along side those of football players. However what determines a CEO salary? Is it bio graphical information? Is it the person’s sex? Education? OR could it be how their company performs? Are CEO salaries simply a rational reward for running a successful company? This is an interesting alternative to the wage’s data set with a more precise focus.This topic may be of interest to accounting students or those with a keen interest in evaluating company performance. This can inform management accounting decision making. It requires an under standing of some key accountancy ratios as these can often be important variables to consider! Topics 4 & 5 maybe useful for this.
5. R&D Spending and Firm Size
The relation between firm size and innovation is a topic that has been much studied in accounting literature how ever theoretical and empirical studies are still inconclusive. Does the firm size profits and/or profit margin determine a firms R&D research and development spending and or R&D intensity (R&D spending as a percentage of sale), or vice versa? Does R&D intensity decrease with firm size? This is particularly pertinent to management accounting decision making within large companies particularly when deciding an optimal level of R&D spending relative to the size of the firm.
Statistics And Data Modelling Assignment
6. Twitter
This dataset gives share price data for both Twitter and the market (S&P 500). Twitter is very interesting at present the day with the proposed takeover of Twitter by Elon Musk. There could be some interesting ways to use this dataset such as beta analysis subset analysis amongst others. Your choice to how you use this data!
In Black board there is a folder which contains the .csv file for each of these datasets.
Ac companying this is an explanation of what each of the variables represents.
You are perfectly welcome to look at each of the datasets before deciding over which one you will choose. We have provided for you a range of data sets and you may select one of these for your assessment. We have split these data sets into subject specialisms how ever if you feel interested by a data set out side of your specialism please feel free to use which ever you prefer.
Note:
There is no expectation that you make use of every variable in your chosen data set.
You can also transform the given data to create additional variables if this helps test
your hypo theses for example you may wish to create an additional variable for log returns in the case of Ethereum or adapt the functional form i.e. taking the log in the wages data).
Statistics And Data Modelling Assignment
Tips and advice.
– Think about the presentation timing of each section You could spend more time on certain sections as defined by the characteristics of the assessment matrix below.
– This assessment will make use of all Topics studied up to the close point of submission
– Try not to change your dataset once you have begun work i.e changing values (your code will be specific to individual datasets, changing your focus will mean you have to write your code again).
– Remember to go back to your tutorial (IT Lab) code and notes!
These will provide key scripts that will help you perform similar functions with your new data alongside the interpretations of out puts.
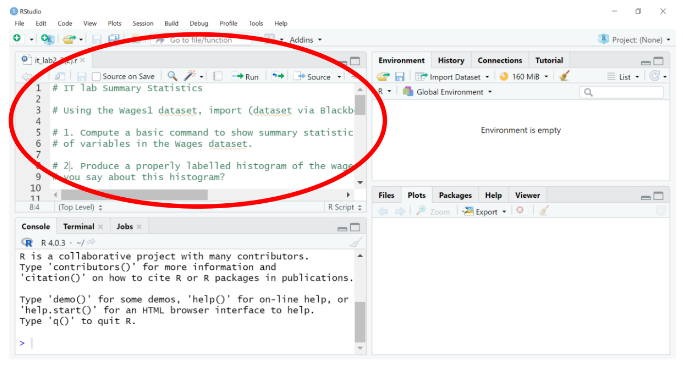
– With R your code allows you to reproduce your analysis time and time again. Make sure you save your code! This is the text which is in the top-left square of R-studio (see below). You can save this as a .r file or even open the notepad on your laptop and save it here.
We may ask to see your r script.
 – If some thing breaks in your code and you don’t know why try to fix it.
Interpret the error message and see if you can get it to work.
If this fails try closing R and starting again. Please remember that R is case sensitive.
ORDER This Statistics And Data Modelling Assignment NOW And Get Instant Discount

Read More :-
CA4051 Statistics For Travel & Tourism Assignment-London Metropolitan

