OIM7504 Supply Chain Analytics & Technology Management Assignment outline
This individual assessment is worth 70% of the overall module marks in which you are required to submit a detailed two-part report highlighting the increasing role of Supply Chain Analytics and other technological advancements within the Supply chain.
Background:
Your consultancy firm understands the importance of data-driven decision making and therefore have made a substantial investment in acquiring a specialist in-house analytics team. You have received many analytics related queries since launching the analytics services, with much interest coming from large organisations who are looking to outsource analytics relating to their supply chain. Therefore, you are requested to produce a report in which you outline the value of a data-driven supply network for organisations.
The report consists of two parts:
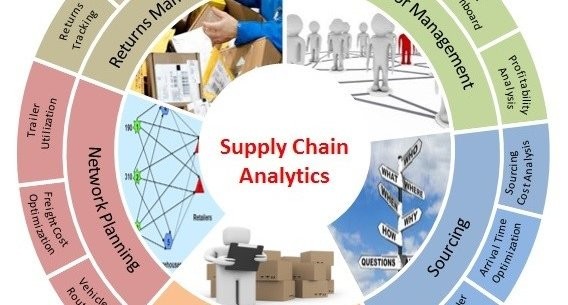
Part A –
a) Critically analyse the value of incorporating supply chain analytics within the supply chain network
b) Provide at least two relevant examples from case studies and refer to relevant academic sources to formulate your arguments
c) Your examples should include the role of analytics at each key stage of the supply chain
d) Propose a data-driven supply network for a potential customer of your choice
Part B –
Through your understanding of R coding, use the provided dataset to build codes specific to supply chain scenarios and provide actionable insights from the data in a clear and concise manner.
Provided dataset
The dataset collects information of 301 customers for the following variables:
- duty: whether the customer has to pay a duty for importing goods;
- size: a proxy for the size of the customer
- TransCost: the transportation cost charged to the customer
- qD: quantity demanded by each customer
- earnings: total earnings reported in the latest annual report of the customer
- n_of_employees: number of employees
You are required to provide the following three items (10%):
i) Provide R codes which you will use to produce, at least, the following items (list your codes in the appendix):
- Descriptive statistics
- Graphs
- Regression analysis
Regarding the regression analysis, you are also required to:
a) determine and justify the choice of the dependent variable
b) Include, as additional independent variable called, “km” and determined
as:
km <- sample(10:2000, 301). This variable will then be added to the data object using the cbind() command.
ii) Provide the dataset in .csv format, which includes your estimated
variable “km” and obtained through the command line, write.csv() (5%) (upload a csv file separately through Canvas)
iii) Provide suitable comments and interpretation to your results, which includes (25%):
a) Comments on the characteristics of the variables emerging from descriptive statistics and graphs
b) Interpretation of regression results
c) Theoretical reasoning and interpretation of hypothesis tests relating to Supply Chain contexts
d) Suggestion of possible actions to be taken conditional on your results.
ORDER This OIM7504 Supply Chain Analytics & Technology Management Assignment NOW And Get Instant Discount

Read More :-
P22004 Supply Chain Management Assessment – Ports Mouth University UK.

